

Ready to improve your marketing ROI?
Fast registration. User-friendly interface. Robust integrations.
Disclaimer: Our overview of important metrics for tracking the performance of a call center is useful for assessing the employees’ work and customer satisfaction levels and for setting goals for further development strategies.
Offering excellent customer service will help you draw in more devoted customers and boost conversion rates. The moment your agent picks up the phone is crucial for your business as it affects the decision-making process of the caller. A customer service agent is a turning point for callers to decide whether to become customers or not. Therefore, call centers should be well equipped. First of all, the staff should be professional and motivated. Second, the analytical tools and programs should be easily manageable and clear for all the team members. Third, there should be an expert and regular assessment of the performance. The third point is where we are going to provide you with more details.
Front-line managers and leaders of customer service teams both need distinct measures to assess the effectiveness of their teams. Estimating how successfully calls are handled, the causes of missed calls, customer satisfaction levels, etc., is crucial for call centers. We have prepared an overview of the essential metrics for any call center’s efficiency. The first ten tools are reviewed on popular platforms as the most important ones for tracking call center performance.
Customer Satisfaction (CSAT)
This metric shows if customers are satisfied with the service they received. Typically, customers are asked directly at the end of the conversation to rate the service from 1 to 5, and to follow up with feedback. It can be done either with a real agent or, which is more common today, with a virtual one. It allows you to assess the performance of the agents in real time, immediately after the call. As a leader of the agents’ team, you can provide your agents with score points for high results from the callers to keep them motivated.
However, the issue with CSTA scores is that often only very dissatisfied customers or, conversely, extremely happy clients wish to leave a review, so the score for this metric cannot be reasonable.
A formula for calculating the general index is the following:
The number of satisfied customers (those who scored 4 and 5) is divided by the total number of customers and multiplied by 100 to receive the figure in %.

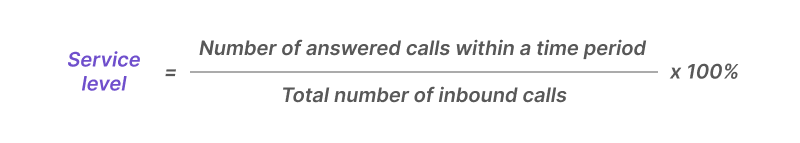
Service Level
This is an important metric as it shows how productive your call center is. By estimating the number of calls that are handled in a limited time period, you can understand if it is easy for the customers to get through and if the staff is competent enough to provide callers with the required information fast.
A good indicator is considered to be 80/20, which means that 80% of calls should be handled within 20 seconds. But this figure is conditional, as it depends on the number of agents in your call center and the number of inbound calls they have to handle.
The most common way to calculate the general service level is the following:
Average Handle Time (AHT)
There is nothing worse than being put on hold for ages. Even the most soothing music fails to calm you down when you need a consultation ASAP. Therefore, the AHT metric is crucial for assessing the productivity of call center agents. It includes the time spent on hold, the conversation itself, and after-call time an agent takes to wrap up a call.
Agents should be able to provide quick and quality assistance on the phone. At the same time, they should not be in a hurry, as it will lower customer satisfaction levels. The speed should be achieved with the competence and expertise of the agents. Thus, business owners should be ready to invest in staff training and skills development.
The metric is calculated in the following manner:
The total time spent on all inbound calls (which includes on-hold time, talk time, and after-call time of an agent) is divided by the number of inbound calls.

First Contact Resolution (FCR)
First contact resolution means that a caller receives competent and sufficient help when they first reach a contact center, and there is no need to call back for further details. Some call centers consider this metric to be the most important one as it demonstrates the professional approach of the agents on the phone. The high metric indicates that your customers are happy with your service, they are likely to recommend your services to their peers, and your staff are competent and reliable.
There are two common ways of measuring the FCR metric. Any call center should decide for itself which one to use.
- The number of calls resolved in a first call is divided by the total number of inbound calls and multiplied by 100%.

- The number of calls resolved in a first call is divided by the total number of first calls and multiplied by 100%.

The second formula provides a more precise figure. It excludes repeated inbound calls.
First Response Time (FRT)
First response time is the period of time spent between the moment a consumer calls to report a problem and an agent tackles that problem. This metric shows both customer satisfaction and the capacity of the call center staff. If the FRT indicator is unsatisfactory, it may indicate the necessity to hire extra agents, as they cannot handle the amount of inbound calls.
Call center owners wish to make the FRT metric as short as possible to have the reputation of a reliable and helpful contact center.
The total time of all the first response times is divided by the number of resolved issues.

Channel Mix
Modern call centers deal with several channels that customers can use to address them. A successful business should think of multiple channels of communication for their customers. As a rule, they include phone numbers, email, messengers, live chats, social media, etc. Not everyone prefers to call. By learning which of these channels are the most effective, managers can allocate more staff to deal with requests from them. Therefore, the working process will be organized more productively.
To determine the most productive channel, you just need to count the number of interactions with customers per each channel.
Call Transfer Rate
This indicator demonstrates how many of the inbound calls are transferred to a different department or a more knowledgeable expert. Callers usually do not appreciate being transferred several times. It may be the reason for irritation. We have an article regarding the ways of dealing with irate customers on our blog.
However, the requests are challenging sometimes, so transfers are inevitable. It is necessary for a contact center to see the percentage of the transferred calls and to investigate the reasons for them. Sometimes a high transfer rate means poor IVR menu settings or insufficient staff skills. Both cases need careful attention.
The number of transferred calls is divided by the general number of inbound calls and multiplied by 100%.

Call Abandonment Rate
This indicator shows how many callers decided to hang up before their request was solved. There may be several reasons for that. First, people may dial a number by mistake. In this situation, the call is abandoned within the first 30 to 40 seconds.
Situations that are more important for call center leaders and managers include when a call is abandoned while being on-hold or while listening to IVR options. The first case means a person is tired of waiting and is highly unlikely to call back. The second means the IVR menu is not well-designed. Both cases require process improvements.
The call abandonment rate of between 5 and 8% is viewed as acceptable. Higher figures indicate the need for immediate optimization.
The number of abandoned calls is divided by the total number of inbound calls and multiplied by 100%.

Average Speed of Answer (ASA)
This metric shows how long it takes for an agent to answer a call on-hold. If the waiting pause is too long, it means that either the agent is talking too much on the phone with a previous caller or the follow-up period after the talk is too short.
This indicator should not be confused with the first response time. The latter shows how much time an agent needs to find the answer, while the ASA is the period a customer waits from the moment they dial a number.
The total on-hold time for answered calls is divided by the number of calls taken.

Agent Utilization Rate
The productivity of a call center depends hugely on the staff’s motivation and job satisfaction. Therefore, it is important to monitor whether employees have relevant workload and do not risk burnout. The agent utilization rate indicates how much of an agent's daily hours are spent actually answering calls. The results may indicate that either your call center is overstaffed or that you might need more team members.
Please note that the rate is calculated separately for each employee and for a limited period of time. Usually, the monitoring is done monthly, so the data per month should be taken into account.
The number of minutes spent on calls is divided by the number of working minutes and multiplied by 100%.

Repeat Calls
This metric is closely related to the first contact resolution. If the latter is low, there will be few repeated calls, and vice versa. Repeated calls related to some specific requests show problem areas for call center managers. Probably, there is a gap in the expertise of the agents that needs to be addressed.
The number of calls connected to a specific request is divided by the total number of calls and multiplied by 100%.
Peak Hour Traffic
This data helps to understand when the workload is the most intense for the employees. It may force the managers to rearrange the schedule accordingly or to attract additional part-time agents during peak hours.
There is no specific formula for this metric. Managers just monitor the number of inbound calls each hour during the working day.
Occupancy Rate
The occupancy rate shows the ratio at which the employees are busy with calls. If an agent utilization rate is calculated per one employee, the occupancy rate indicates the productivity of the whole call center team. Generally, an indicator of 75-85% is optimal. If the figure approaches 100%, it may indicate the possibility of agents’ burning out.
There are online tools like the Erlang Calculator that can be used to find out the occupancy rate and decide an ideal staffing number for a call center.
Net Promoter Score (NPS)
This metric is measured with the help of a simple question that customers are asked: How likely are you to recommend our service on a scale from 0 to 10? Those who answered 9 or 10 are promoters, 7 or 8 are passives, and 0 to 6 are detractors. The more promoters you have, the better the word-of-mouth advertising will work.
The formula for the NPS is simple:
Subtract the percentage rate of detractors from the percentage rate of promoters.
Customer Retention Rate (CRR)
This metric is relevant for internal call centers that are part of a business producing services and goods. The customer retention rate indicates the number of loyal customers. High CRR levels prove high revenue rates. Loyal customers become brand ambassadors for your company, telling their peers about your goods and services.
Subtract the number of new customers from the total number of customers over a specific period of time. This figure must be divided by the number of customers at the beginning of that time period and multiplied by 100%.
Customer Effort Score (CES)
CES is similar to NPS in that it offers customers one question. It is “On a scale from 1 to 5 (or 7), how easy was it for you to solve the problem with the help of our services?” The results of the survey will indicate if your customers are likely to stick with your services.
Subtract the percentage rate of those who ranked 1 from the percentage rate of those who ranked 5 (or 7).
Contact Quality
This metric indicates the general impression of the phone service that a caller receives. A call should leave a positive and satisfying feeling after the interaction. This indicator is difficult to measure with the help of any formula. That’s why managers and team leaders turn to call recordings to assess the performance of agents and to understand the impressions of callers. We have discussed the benefits of the call recording feature in one of our blog posts.
Callback Messaging
The feature of a callback request is convenient for those customers who do not have time to wait for an answer. On the other hand, it is a handy option for the general performance of a call center, as there will be no missed calls and all the requests will be addressed. Customer satisfaction depends on the speed at which a call back will be made and the quality of the help.
To know the callback messaging ratio, you just need to count the number of callback requests per some limited period of time. If the figure is too high, it means your team needs extra staff to deal with the inbound calls.
Call Volume
This indicator is connected to the peak hour traffic. Call volume, however, provides team leaders with information about the busiest time periods for a call center. It may depend on the season or time of the day, for instance, and can trigger employers to hire extra staff during a busy season.
Average Hold Time (Average Time in Queue)
This is the time spent on hold before a call is processed. Ideally, this period should be kept as short as possible. Customers enjoy fast service and high-quality help.
The total time spent on hold is divided by the number of inbound calls.
Average after-Call Work (ACW)
Usually, an agent needs some time after the call to take notes and update some data in the call log. Ideally, this process should take a couple of seconds, after which an agent should be ready to take the next call. Front-line managers calculate the ACW metric for the evaluation of an employee’s progress.
Time spent after calls by one agent during a limited time period is divided by the number of calls during the same time period.
Active Waiting Calls
Those are the calls on hold. This indicator can be calculated for an individual agent, a team, or a whole contact center. It shows if the center or an employee is ready to process all the inbound calls. Otherwise, a call center is ineffective and the team is under constant stress.
The number of calls on hold is divided by the number of calls being processed at the same moment and multiplied by 100%.
Percentage of Calls Blocked
Blocked calls are those when a calling person hears a busy signal. Sometimes that is done purposefully to get rid of the spammers. However, if all the agents are unavailable, callers will also fail to get through. This metric is important to estimate the workload and optimize the settings for receiving calls, if necessary.
The number of blocked calls is divided by the total number of inbound calls and multiplied by 100%.
Cost Per Call (CPC)
The cost per call is necessary to know to estimate the productivity of a call center. It helps to allocate resources efficiently. The time period is chosen individually by each business. Monthly trends, though, can provide a company with important insights.
Total operating costs are divided by the amount of calls per month.
Call Type Mix
This indicator measures the number of calls divided by the type of requests, for example, issues with technical support, sales department, logistics, etc. It can help to optimize the IVR menu and to understand which department handles most of the calls.
The figure is calculated simply by counting the number of calls according to the types indicated.
Call Availability
Call availability shows how many agents are available at a given time and ready to take the next call on hold. This metric is closely related to the call volume and peak hour traffic indicators. All of them help to estimate busy and relaxed times in a call center and plan the schedule for the team accordingly.
The calls on hold are subtracted from the number of agents not involved in a call currently.
Call Arrival Rate
This is a standard metric for a call center. It indicated the number of inbound calls per day. The information is usually updated daily. Additionally, there may be a call arrival rate per hour, per minute, or per second depending on the general workload.
Average Age of Query
This metric takes into account challenging issues. It indicates the average time that is necessary to solve a problem that needs special attention. First contact resolutions are not counted here. The indicator helps to understand how competent the staff is and how quickly more qualified agents may step in to assist.
The time queries stay open is divided by the number of open queries.
Agent Attrition Rate
This indicates the staff turnover. It is always hard to train new staff and grow experts from them just to know that they will leave in a couple of months. If the agent attrition rate is too high, there might be problems with the staff motivation, stress levels, etc. Therefore, measures to provide employees with more satisfying working conditions should be taken.
The number of employees who resigned is divided by the total number of employees during a particular period of time and multiplied by 100%.
Wrap-up Time
Competent agents working at convenient hours are able to provide customers with quality assistance over the phone. Performance metrics allow managers to track the efforts of the staff and to pinpoint the areas that need improvement.
Dialics call tracking offers software for call centers that enables them to rationally allocate calls, set up IVR features, monitor performance, and enter international markets. If you are interested in the possibilities of Dialics for your call or contact center, do not hesitate to request a demo. Our technical team will be pleased to help you out.
Ready to improve your marketing ROI?
Fast registration. User-friendly interface. Robust integrations.